Pulmonx Corporation (LUNG)
Full history for every metric is available with a Kvantra account
No price history available.
Key financial summary
Financials in USD| 2020 | 2021 | 2022 | 2023 | 2024 | 2025 | TTM | 2026E | ||
|---|---|---|---|---|---|---|---|---|---|
| Total revenue | $m | 33 | 48 | 54 | 69 | 84 | 90 | 87 | 91 |
| Operating profit | $m | -54 | -46 | ||||||
| Net profit | $m | -32 | -49 | -59 | -61 | -56 | -54 | -48 | -42 |
| EPS reported | $ | -1.33 | -1.15 | ||||||
| Operating cashflow per share | $ | -0.80 | -0.72 | ||||||
| Capex per share | $ | 0.01 | 0.00 | ||||||
| FCF per share | $ | -0.81 | -0.73 | ||||||
| Free cash flow | $m | -33 | -31 | ||||||
| Net debt | $m | -32 | -18 | ||||||
| Book value equity | $m | 54 | 39 | ||||||
| Book value per share | $ | 1.33 | 0.93 | ||||||
| Number of shares | m | 40.69 | 42.18 | ||||||
| DPS (TTM paid) | $ | 0.00 | 0.00 |
Financial summary
Financials in USD| 2020 | 2021 | 2022 | 2023 | 2024 | 2025 | TTM | 2026E | ||
|---|---|---|---|---|---|---|---|---|---|
| Value | |||||||||
| P/E TTM | x | - | - | ||||||
| P/B LTM | x | 1.66 | 2.29 | ||||||
| P/S LTM | x | 0.99 | 1.03 | ||||||
| P/FCF LTM | x | -2.73 | -2.93 | ||||||
| EV/EBITDA LTM | x | -1.55 | -1.77 | ||||||
| EV/Sales LTM | x | 0.84 | 1.17 | ||||||
| Earnings Yield LTM | % | -60.06% | -47.13% | ||||||
| FCF Yield | % | -36.59% | -34.11% | ||||||
| Quality | |||||||||
| ROE | % | -99.79% | -96.66% | ||||||
| ROIC | % | -48.54% | -48.39% | ||||||
| Operating margin | % | -59.30% | -52.96% | ||||||
| Gross margin | % | +74.19% | +77.06% | ||||||
| FCF/Sales | % | -36.35% | -35.07% | ||||||
| Growth and momentum | |||||||||
| EPS Growth YoY | % | - | - | ||||||
| Sales Growth YoY | % | +8.01% | +4.36% | ||||||
| Net Income Growth YoY | % | - | - | ||||||
| FCF Growth | % | - | - | ||||||
| Operating Profit Growth | % | - | - | ||||||
| Dividend and capital structure | |||||||||
| Dividend Yield | % | 0.00% | 0.00% | ||||||
| Dividend Growth | % | - | - | ||||||
| Payout Ratio | % | 0.00% | 0.00% | ||||||
| FCF/Debt | x | -0.58 | -0.55 | ||||||
| Net Debt/EBITDA | x | 0.28 | -0.01 | ||||||
| EBIT/Net interest | x | -17.01 | -12.29 | ||||||
| Net debt/market cap | % | +42.60% | +54.99% | ||||||
| Net debt/Equity | x | -0.59 | -0.47 | ||||||
| Gross debt/equity | x | 1.04 | 1.43 | ||||||
Price target estimates
Based on consensus from external analysts. Not Kvantra's opinion.
Ratings
Based on consensus from external analysts. Not Kvantra's opinion.
ESG
| Metric | 2024 | 2025 | 2026 |
|---|---|---|---|
| ESG-score | |||
| Environmental score | |||
| Social score | |||
| Governance score | |||
| Risk rating |
Company overview
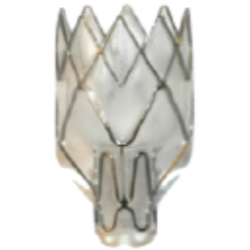
Pulmonx Corporation is a biomedical technology firm dedicated to developing and commercializing advanced, less invasive devices for managing chronic obstructive pulmonary diseases. Its primary offering, the Zephyr Endobronchial Valve, is specifically engineered to treat bronchoscopic hyperinflation in adults afflicted with severe emphysema. Complementing its therapeutic solutions, the company also provides the Chartis Pulmonary Assessment System. This system features a specialized balloon catheter and console, fitted with flow and pressure sensors, which is instrumental in evaluating the presence of collateral ventilation in patients. Additionally, Pulmonx offers the StratX Lung Analysis Platform, a cloud-based service that conducts quantitative computed tomography (CT) analysis. This platform delivers vital data concerning emphysema destruction, fissure completeness, and lobar volume, thereby aiding clinicians in accurately identifying the most suitable target lobes for treatment with Zephyr Valves. Pulmonx serves emphysema patients across a broad international footprint, encompassing the United States, Europe, the Middle East, Africa, and the Asia-Pacific region. The company, which changed its name from Pulmonx to Pulmonx Corporation in December 2013, was originally incorporated in 1995 and maintains its corporate headquarters in Redwood City, California.
Similar companies
For informational purposes only. Kvantra provides data and quantitative analysis, not investment advice. KvantraRank is a mechanical model output. Analyst price targets and ratings are sourced from third parties and are not Kvantra recommendations. Past performance does not guarantee future results; all investments carry risk.
No price history available.
Consensus from external analysts. Not Kvantra's opinion.
Based on consensus from external analysts. Not Kvantra's opinion.
Pulmonx Corporation is a biomedical technology firm dedicated to developing and commercializing advanced, less invasive devices for managing chronic obstructive pulmonary diseases. Its primary offering, the Zephyr Endobronchial Valve, is specifically engineered to treat bronchoscopic hyperinflation in adults afflicted with severe emphysema. Complementing its therapeutic solutions, the company also provides the Chartis Pulmonary Assessment System. This system features a specialized balloon catheter and console, fitted with flow and pressure sensors, which is instrumental in evaluating the presence of collateral ventilation in patients. Additionally, Pulmonx offers the StratX Lung Analysis Platform, a cloud-based service that conducts quantitative computed tomography (CT) analysis. This platform delivers vital data concerning emphysema destruction, fissure completeness, and lobar volume, thereby aiding clinicians in accurately identifying the most suitable target lobes for treatment with Zephyr Valves. Pulmonx serves emphysema patients across a broad international footprint, encompassing the United States, Europe, the Middle East, Africa, and the Asia-Pacific region. The company, which changed its name from Pulmonx to Pulmonx Corporation in December 2013, was originally incorporated in 1995 and maintains its corporate headquarters in Redwood City, California.
Unlock all fundamental data
Sign up for FreeUnlock all fundamental data
Sign up for Free