The tools, one at a time.
KvantraRank and the screener have pages of their own. These five are the rest of the desk.
Stock Profile
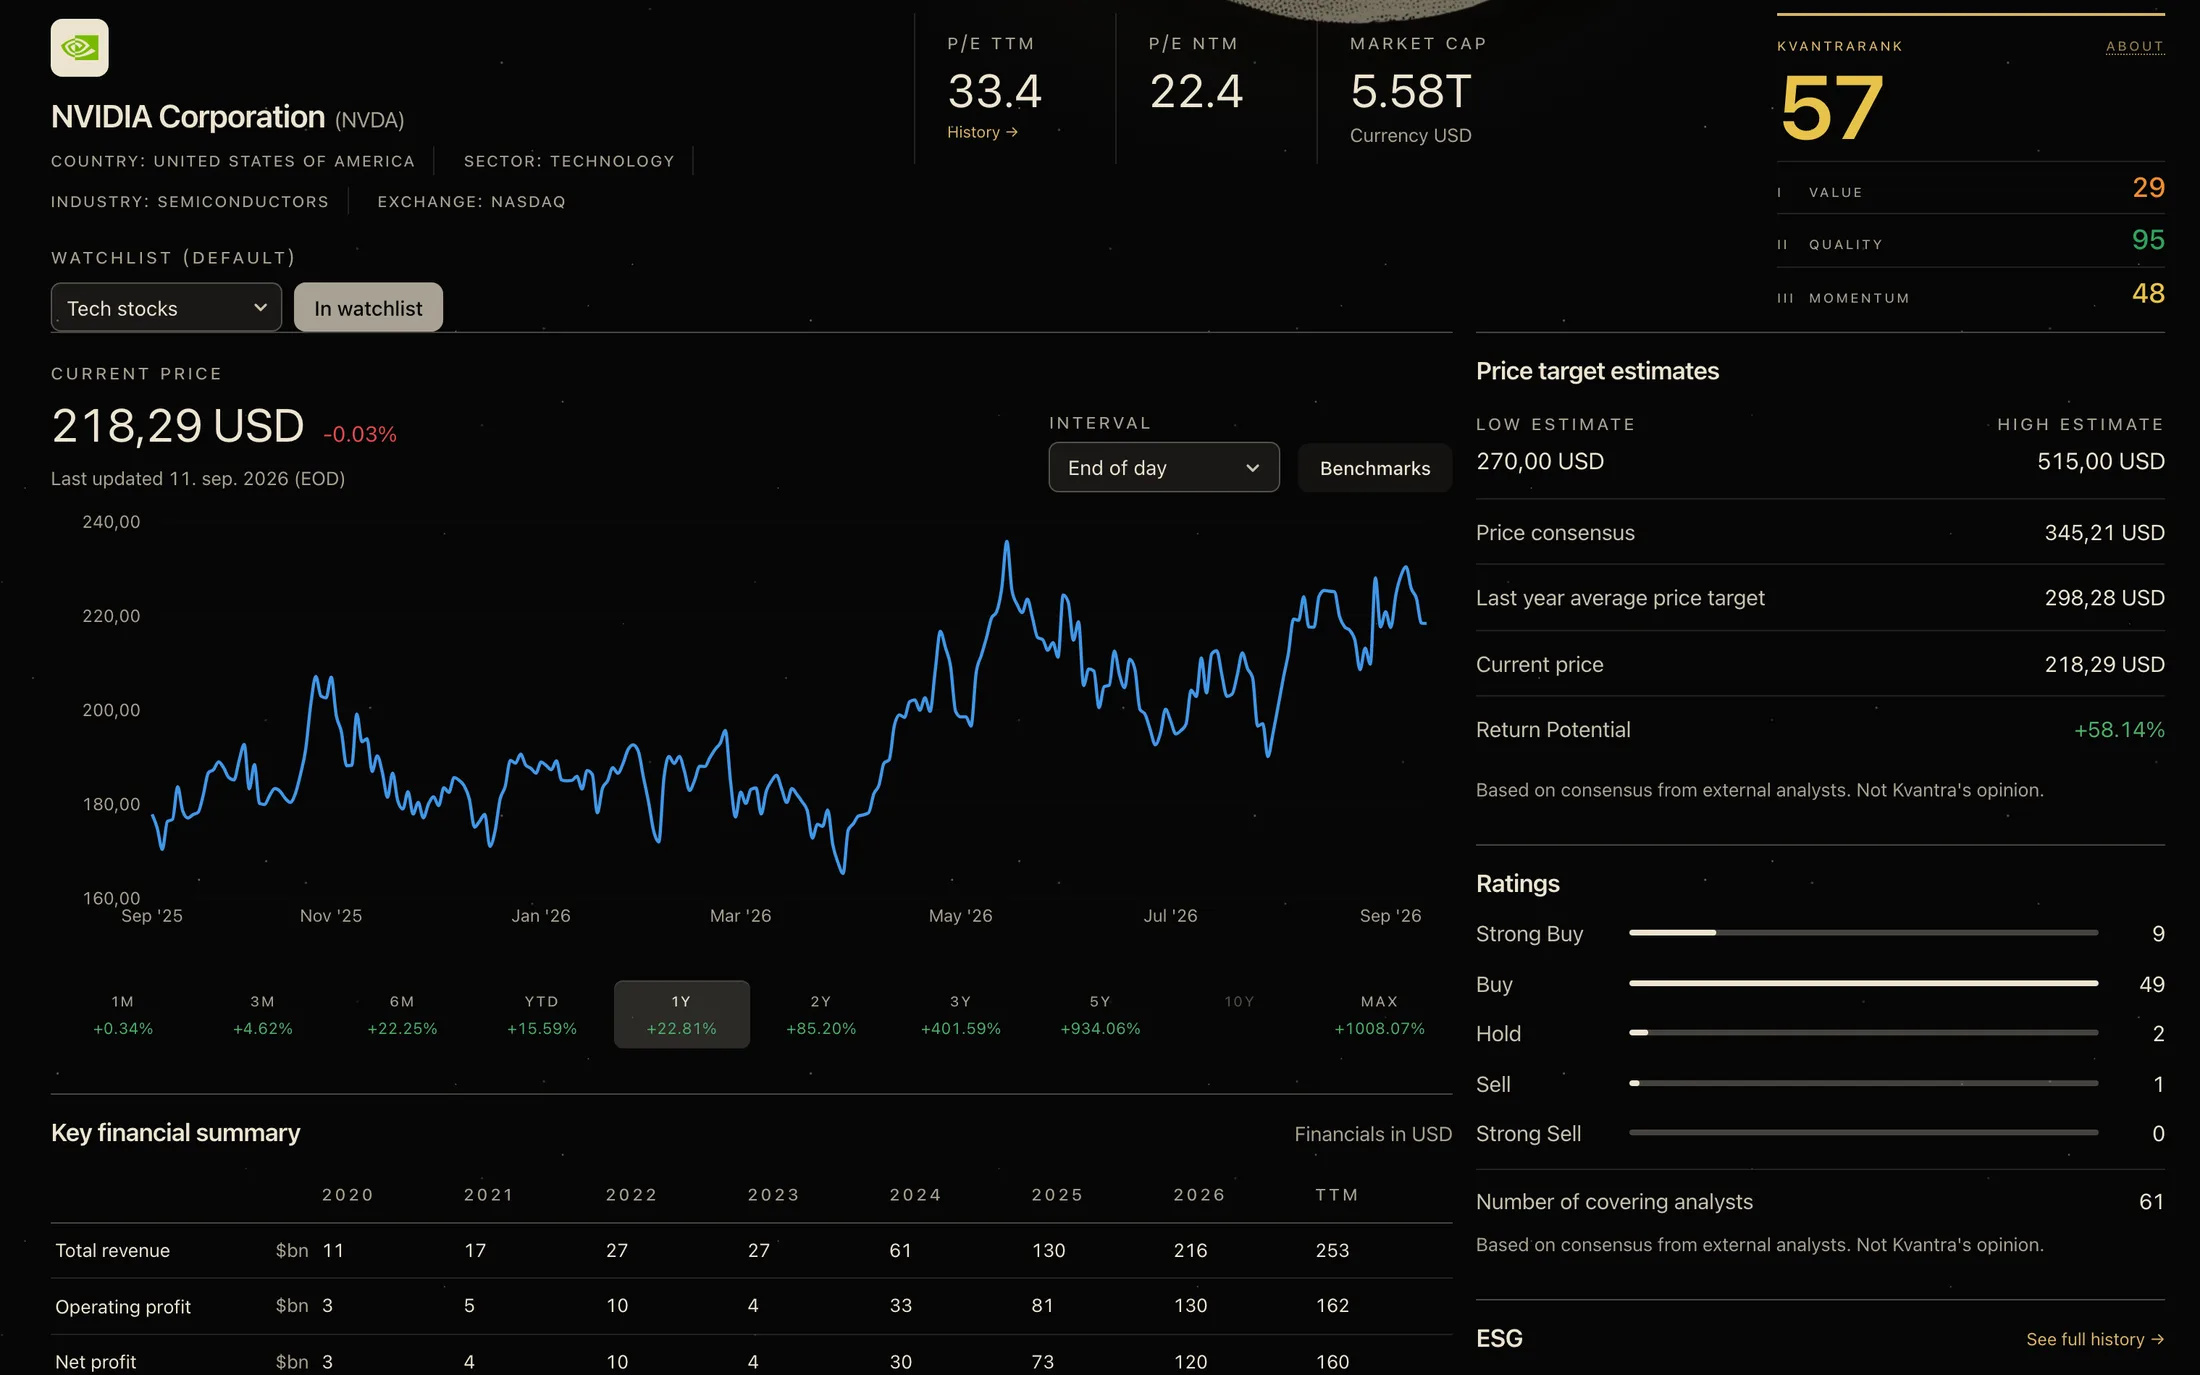
One company, one screen.
The score, the price chart, the analyst consensus, the financial history and the valuation history sit on a single page.
The header carries the rank beside the P/E trailing twelve months, P/E next twelve months, and the market cap in your custom currency. The chart runs from one month to the full history and takes any benchmark you add. Under the rank: the consensus target and the return it implies, the analyst ratings with the number of analysts behind them, full ESG history, and the financial summary year by year.
- Financial history
- Up to 30 years
- Valuation
- Historical P/E with statistical bands
- Analysts
- Consensus, ratings, estimates
- Also on the page
- KvantraRank, price chart, ESG

Watchlist
The companies you are following, side by side.
Custom lists of the companies you are watching, with prices, targets and the metrics you would check anyway in one organised place.
Each list is a table you read across: the last price with your target beside it, the P/E next twelve months, EPS growth on the trailing twelve, and total return both year to date and over one year.
- Lists
- Custom, named, as many as you keep
- Beside the price
- Your own target

Portfolio
What you own, and how it is actually doing.
All your holdings in one place: performance over time, measured against a benchmark you choose, with the portfolio's own KvantraRank.
A holding is entered the way you bought it, as shares, price per share, date and fees, in the portfolio's base currency, so the capital gain and the portfolio return are the real ones rather than a price change. Keep more than one portfolio if you run more than one strategy, and read PortfolioRank: the same 0 to 100 score applied to everything you hold at once.
- Entered as
- Shares, price, date and fees
- Currency
- Custom
- Compared against
- Benchmarks you choose
- Scored
- PortfolioRank, 0 to 100
Alerts
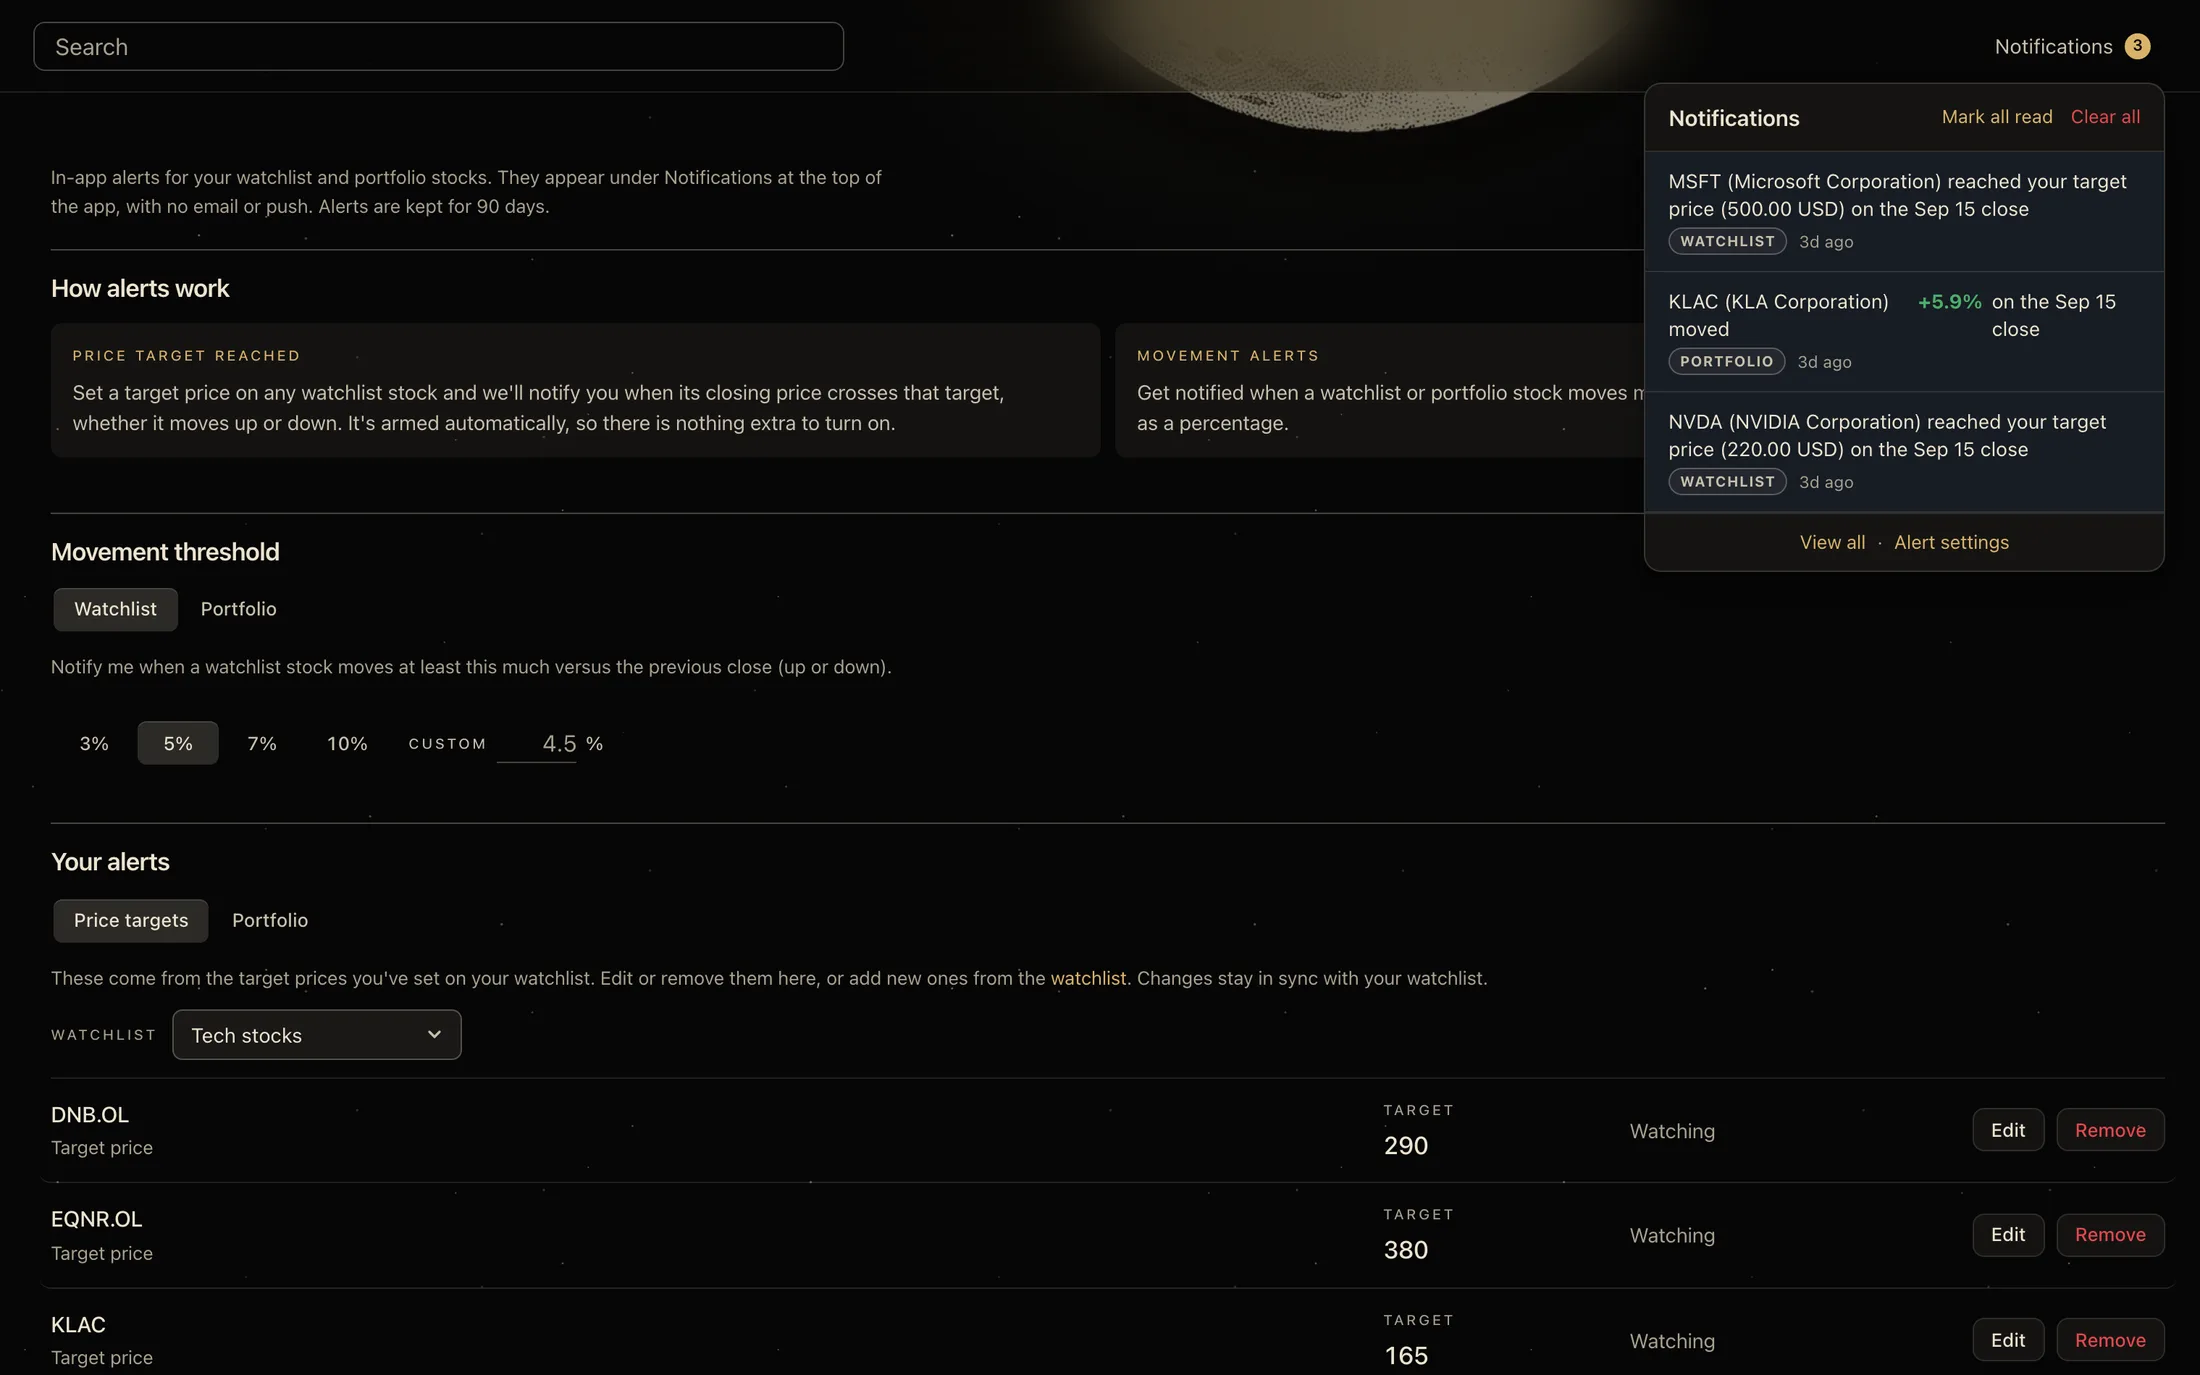
The one time you want to be interrupted.
Set the price you would buy at, and Kvantra keeps it beside the live one. When the close reaches your target, or a holding moves more than your own daily threshold, the alert is waiting at the bell.
Nothing is pushed at you while the market is open. Alerts are measured on the latest closing price and collected at the bell, so the platform interrupts you once, on a number you chose, instead of every time a price ticks.
- Price targets
- On watchlist and portfolio stocks
- Measured on
- The latest closing price
- Kept for
- 90 days

Dashboard
The first screen after login.
Your market overview in one place: the indices you follow, the day's movers, and a snapshot of the portfolio and the watchlist the moment you log in.
The index list runs from OSEBX and the Nordic exchanges through the S&P 500, NASDAQ, FTSE 100, DAX, CAC 40 and IBEX, and any of them can be drawn on one chart to be compared. Under that sit the day's winners and losers by country, commodities and crypto, and the market news, with the portfolio's value and the watchlist's targets down the right.
- Indexes
- Global coverage
- Also on the screen
- Winners and losers, commodities, crypto
- Down the right
- Portfolio value, watchlist targets
- Vidar Aasestrand“The dashboard is very clear and easy to use”
- Mathias“Quick and easy to create an account”
- Alex Hagerup“Helped me invest better”
- Øyvind L.“a professional and user-friendly platform for stock analysis”
- Thias_ Brunvoll“helps me make good decisions”
- Tor Marthin“Clear layout and good visualization”
- S.W.R“The KvantraRank feature is super helpful”